




Most Bali property coverage assumes the answer is a villa. REID's H1 2026 data suggests the question deserves asking properly, because the three main property types perform very differently, and not always in the direction you would expect.
Where the Nights Actually Go
Across the five areas REID tracks, villas accounted for roughly 1.43 million booked nights in the first half of 2026, guest houses around 1.03 million, and apartments approximately 130,000.
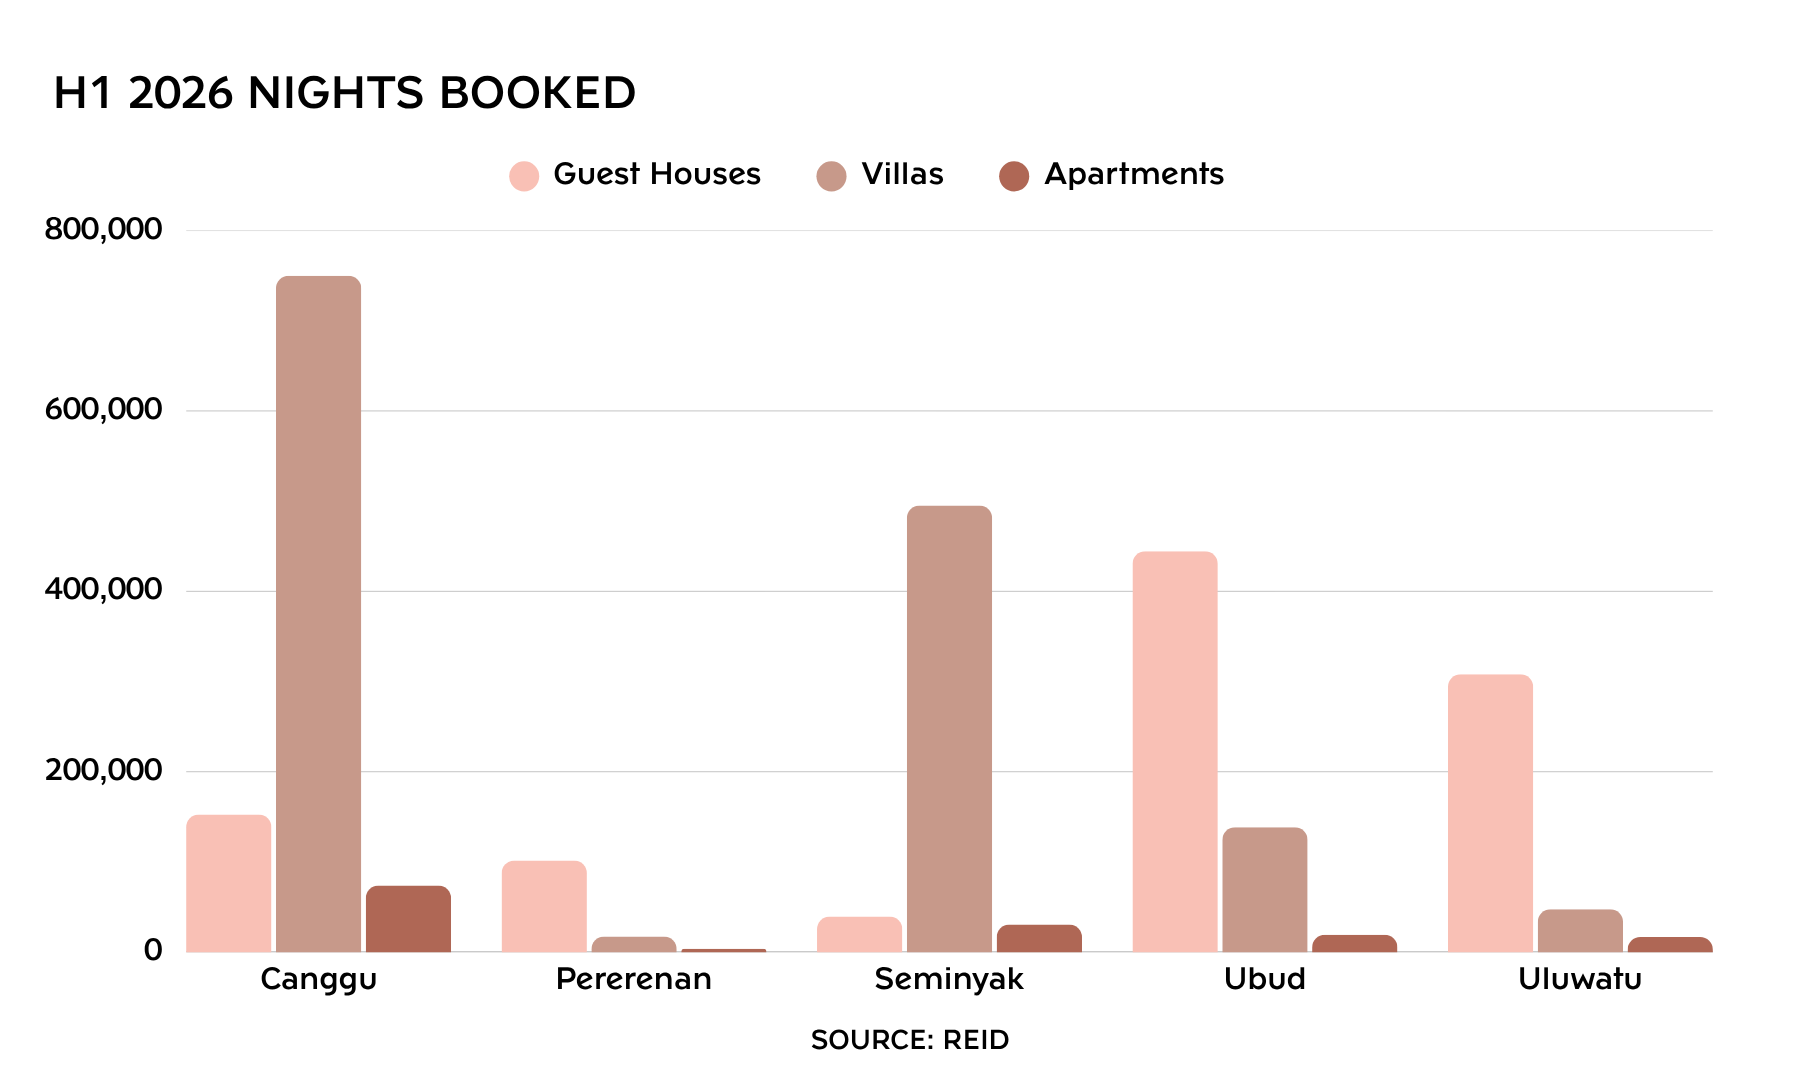
In share terms that is 55% for villas, 40% for guest houses and 5% for apartments. Villas capture eleven times more booked nights than apartments and around 1.4 times more than guest houses.
The apartment figure is the one worth sitting with. Apartments make up 11% of Bali's property supply but account for just 5% of booked nights across these areas. Whatever the segment's merits, it is not where rental demand currently concentrates.
The Guest House Story
Guest houses are the quiet second force in Bali's rental market, and their distribution is uneven in a way that shapes how entire areas read.
In Pererenan, guest houses account for 85% of booked nights. In Uluwatu, 84%. In Ubud, 74%. Those three areas are guest house markets that also happen to contain villas.
Canggu and Seminyak run the other way. Villas take 77% of Canggu's booked nights and 88% of Seminyak's, making them the island's genuine villa markets.
That distinction explains why area-level statistics so often appear to contradict each other. An area where guest houses dominate demand will post blended figures that say very little about how its villas perform.
Per Property, the Picture Narrows
Total nights measure market size. Average nights per property measure how reliably an individual listing books, and on that basis the three types are much closer together.
Apartments averaged 113 nights in the first half of 2026, villas 108, and guest houses 83. Converted to occupancy that is roughly 62%, 59% and 46%.
So apartments do fill marginally more often than villas. The reason is booking length rather than desirability: a guest staying three weeks fills 21 nights through one reservation, where a villa turning over every four nights needs five separate bookings to match it. Apartments also sit at a lower nightly price point and cluster in dense, walkable areas, both of which support consistent occupancy.
But a five-night average advantage across a segment holding 5% of booked nights is a small effect on a small base. Villas fill nearly as often across a market eleven times larger.
Seminyak Runs the Other Way
Seminyak is the exception on both measures, and instructively so. Apartments there booked 86 nights against 105 for villas, the only area where villas fill more often per property.
Seminyak's demand is built on short premium stays rather than extended ones. Guests come for a week of beach clubs and dining, and they want a private pool. That guest profile favours villas, and it demonstrates that property type cannot be assessed independently of the market it sits in.
What You Are Actually Buying
Beyond booking patterns, the three types differ substantially in what they represent as assets.
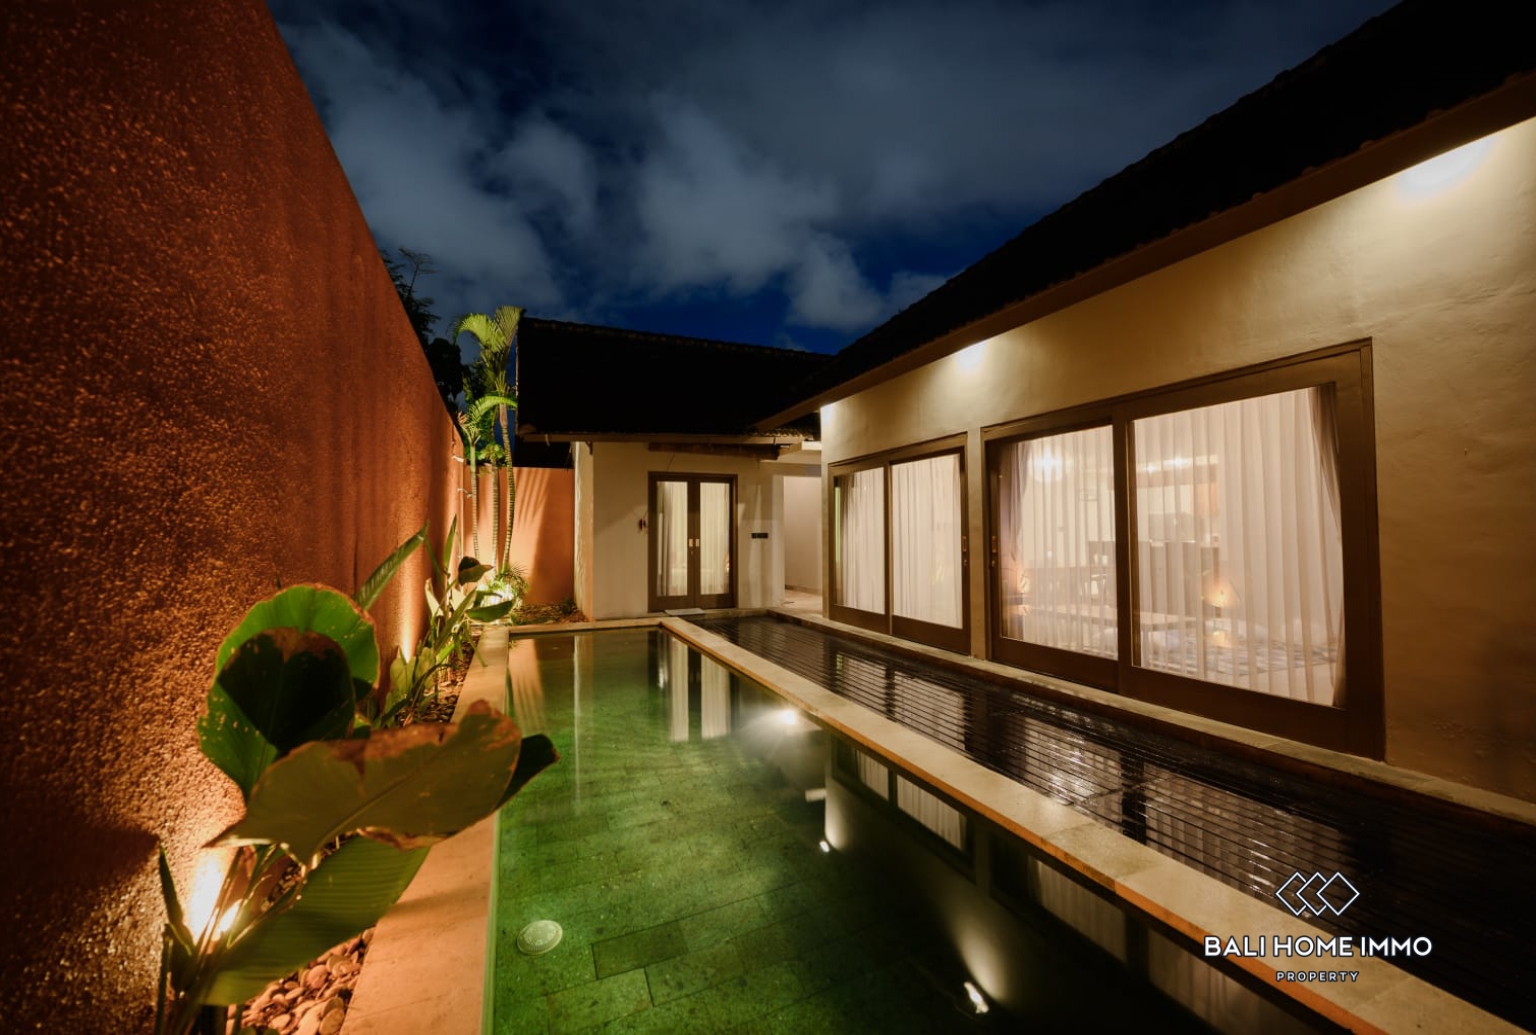
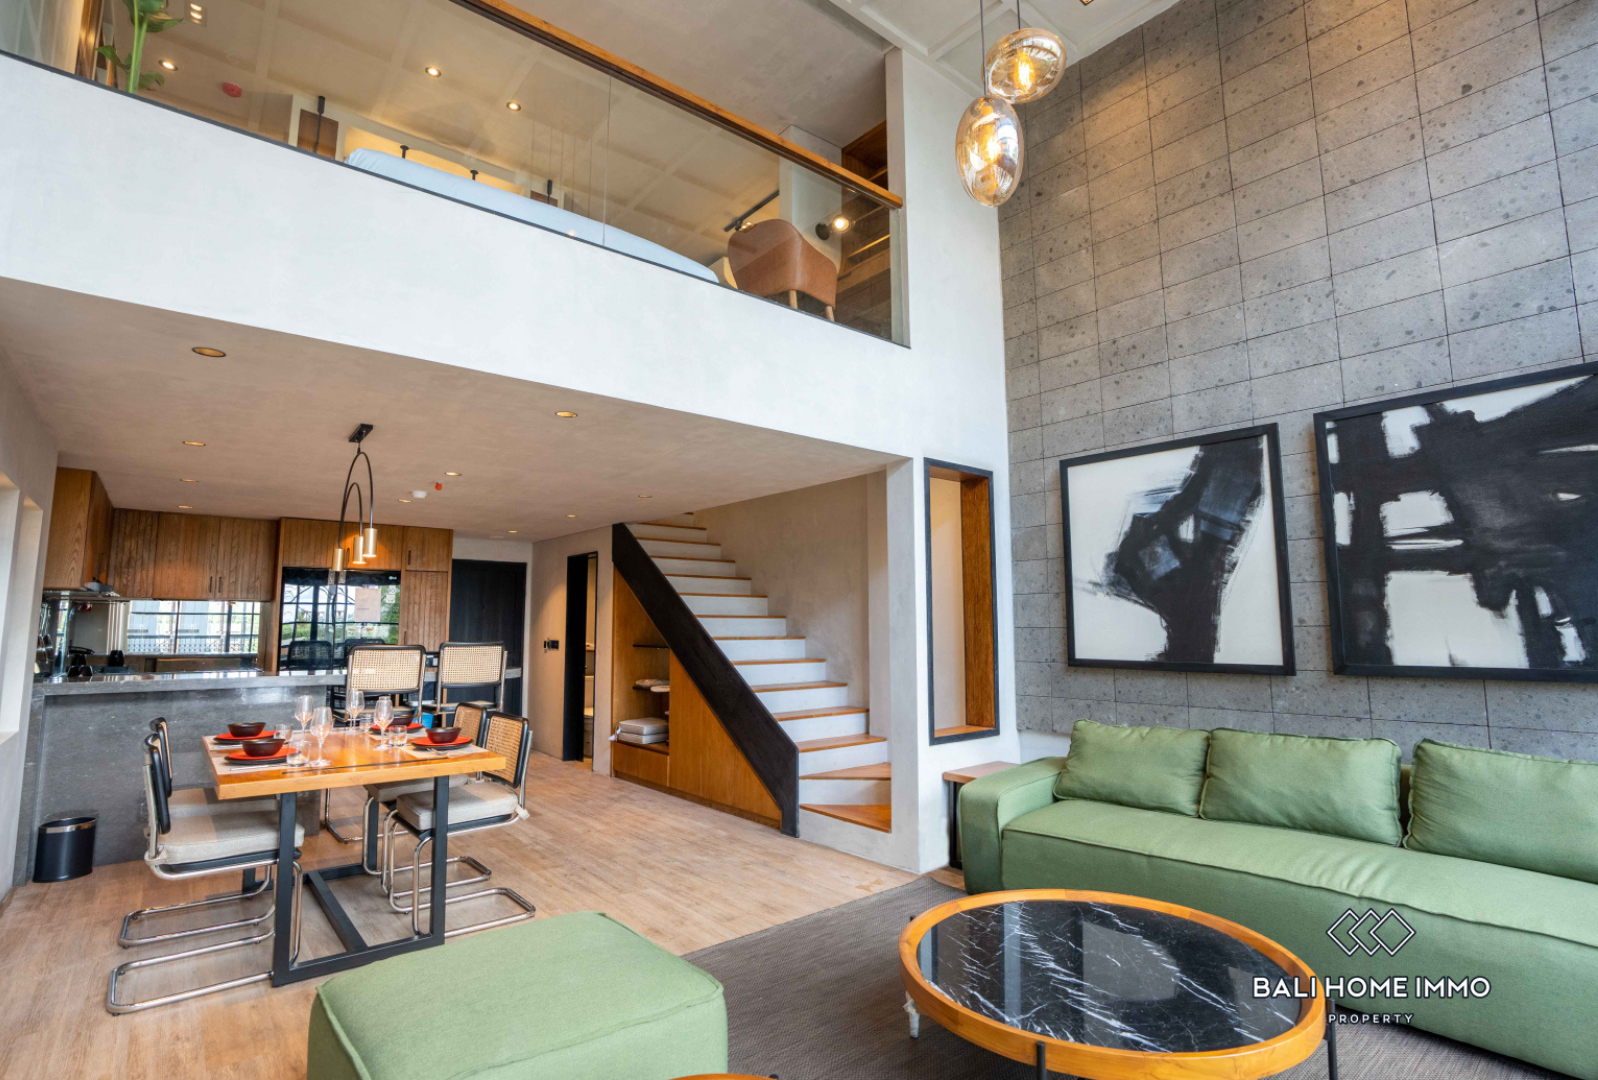
Villas average 241 sqm; apartments average 74 sqm. Apartments also carry a higher price per square metre at Rp 47,430,000 ($3,060) against a market average of Rp 30,612,500 ($1,975), so you pay more per metre for roughly a third of the space.
On a rough basis that puts an average villa near Rp 6,882,000,000 ($444,000) and an average apartment around Rp 3,503,000,000 ($226,000). The apartment costs about half as much, but occupies a fraction of the footprint and comes with no land component.
Land is what appreciates. A villa purchase includes it; an apartment purchase does not.
The Supply Picture Points the Same Way
Market direction reinforces what the demand data shows.
Villas now account for 89% of available supply and 90% of transactions, up from 87% a year earlier. Apartments' relative share of sales fell 13% year-on-year, and their price per square metre dropped 8% against a 5% market-wide decline.
Delivery stage is the other divide. 75% of apartment supply is still off-plan, against 30% for villas. Most apartment stock currently listed has not been built, so its performance rests on construction timelines rather than demonstrable rental history.
Reading This by Type
Villas carry the land component and dominate both supply and demand. They generate the deepest comparable evidence when buying and the widest buyer pool at exit. Villa occupancy across the five main areas holds within a tight 56% to 63% band, which points to consistent demand rather than concentration in any single location.
Guest houses are a larger force than their profile suggests, at 40% of booked nights. They perform strongly in Pererenan, Ubud and Uluwatu, where they carry the majority of demand, and far less so in Seminyak at 7%. Location selection matters more for this type than either of the others: the 39-night gap between Canggu and Ubud per property is the widest spread in the dataset.
Apartments offer a lower entry point and a slight per-property occupancy edge, particularly where extended-stay demand is established. The trade-offs are the small market share, no land, higher cost per square metre and heavy off-plan exposure.
What Separates Performers Within Each Type
Across every category, operation matters as much as classification.
Market-wide occupancy rose a relative 10% year-on-year to 52% while rental supply grew 5% to 44,750 properties. Demand is absorbing new stock, which makes pricing strategy and listing quality more consequential than they were two years ago.
Professional villa management bali services handle dynamic pricing, guest communication, housekeeping and maintenance scheduling. In a market with more listings competing for a growing guest base, the difference between an actively managed property and a passive listing shows up quickly in both occupancy and reviews.
Rental income in Bali figures quoted at area or property-type level are always gross. Management fees, platform commissions, staffing, utilities, maintenance and vacancy come off before anything reaches an owner.