





Bali’s southwest coast still revolves around one corridor: Kuta-Legian-Seminyak, with Kerobokan acting as the inland connector that absorbs overflow demand. Even as villa supply expands in 2025-2026, this strip behaves like a mature economic engine: the infrastructure is already built, the guest’s mental map is already formed, and commercial real estate remains defensible when attention drifts to newer districts. For investors, the advantage is clarity. Pricing power here is created by a predictable relationship between geography and commercial velocity, how reliably demand converts into booked nights, and how reliably that converts into revenue.
Land valuation reflects that structure. Along this coastline, pricing is dictated by proximity to the beach and by historical commercial intensity, producing clear tiers that help protect ROI. The Airbtics historical performance charts tracking nightly rates, occupancy, and gross revenues from April through March confirm a fundamental market rule: beachfront positioning lifts the performance ceiling, but identifying the optimal tier depends entirely on whether an acquisition strategy prioritizes prestige, raw volume, or cost efficiency.
Reading the Map Area by Area
To build a defensible business case, an investor must read the land map area by area, because each block signals a different commercial logic.
Tier 1: Seminyak Beachside (The Premium Core)
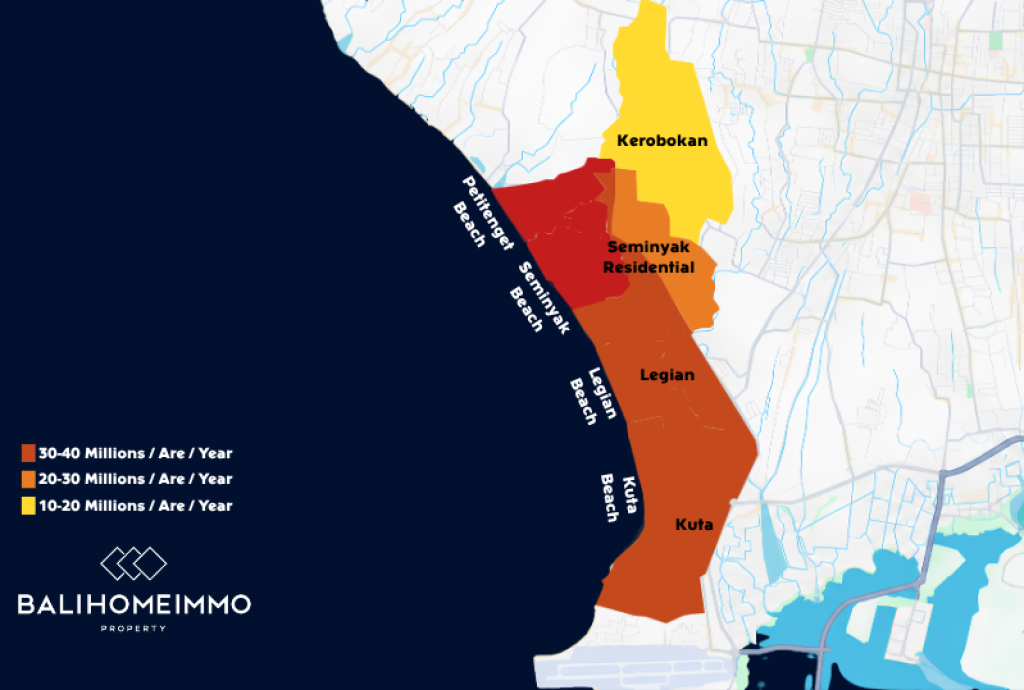
Seminyak Beachside sits firmly within the top 30.000.000-40.000.000 IDR (approx. $1,875-$2,500 USD) per are per year band. This dark red coastal stretch represents the premium core where land is priced directly against scarcity. The address carries permanent commercial weight, property access remains uncompromised, and development concepts are expected to be luxury by default. Capital placement here is heavily insulated by immediate proximity to the island's premier lifestyle anchors.
Tier 2: Legian, Kuta, and Kerobokan (The High-Velocity Commercial Artery)
Legian and Kuta occupy the intermediate 20.000.000-30.000.000 IDR (approx. $1,250-$1,875 USD) orange band. These micro-markets are structured strictly around high operational throughput: dense commercial positioning, massive guest turnover, and a product mix designed to capture rapid foot traffic rather than secluded exclusivity.
Kerobokan also sits in this 20.000.000-30.000.000 IDR (approx. $1,250-$1,875 USD) band, but functions as a strategic inland connector rather than a beachfront destination. Its commercial value centers on geographic adjacency. It allows developers to build larger architectural footprints with deeper residential functionality, maintaining direct access to the same coastal demand waves when the immediate beachfront strip reaches peak capacity.
Tier 3: Seminyak Residential (The Pragmatic Yield Zone)
Seminyak Residential is the yellow enclave operating within the 10.000.000-20.000.000 IDR (approx. $625-$1,250 USD) lease band. Geographically, it sits close enough to directly borrow Seminyak’s primary demand engine, yet it remains priced at a deep discount because it sits back from the active beachfront strip. As a result of this low capital expenditure baseline, this specific pocket frequently produces the strongest efficiency-to-cost outcomes in the southern market.
Where Pricing Power Concentrates
With the tiers established, the performance charts must be analyzed separately to understand how pricing power, absorption, and seasonality interact to dictate true earnings.
The nightly rate chart makes the clear dominance of Tier 1 real estate evident. Seminyak Beachside holds the highest Average Daily Rate (ADR) across the entire calendar, using the low-to-mid 3.200.000 IDR range (approx. $200 USD) as an absolute baseline and lifting past 4.000.000 IDR (approx. $250 USD) to touch nearly 4.300.000 IDR (approx. $270 USD) during peak holiday periods. The critical takeaway for an investor is that this pricing premium persists even during softer seasonal months. This is exactly what developers buy when they pay for the top land band: the ability to maintain premium pricing without needing to rely on aggressive discount strategies to sustain bookings.
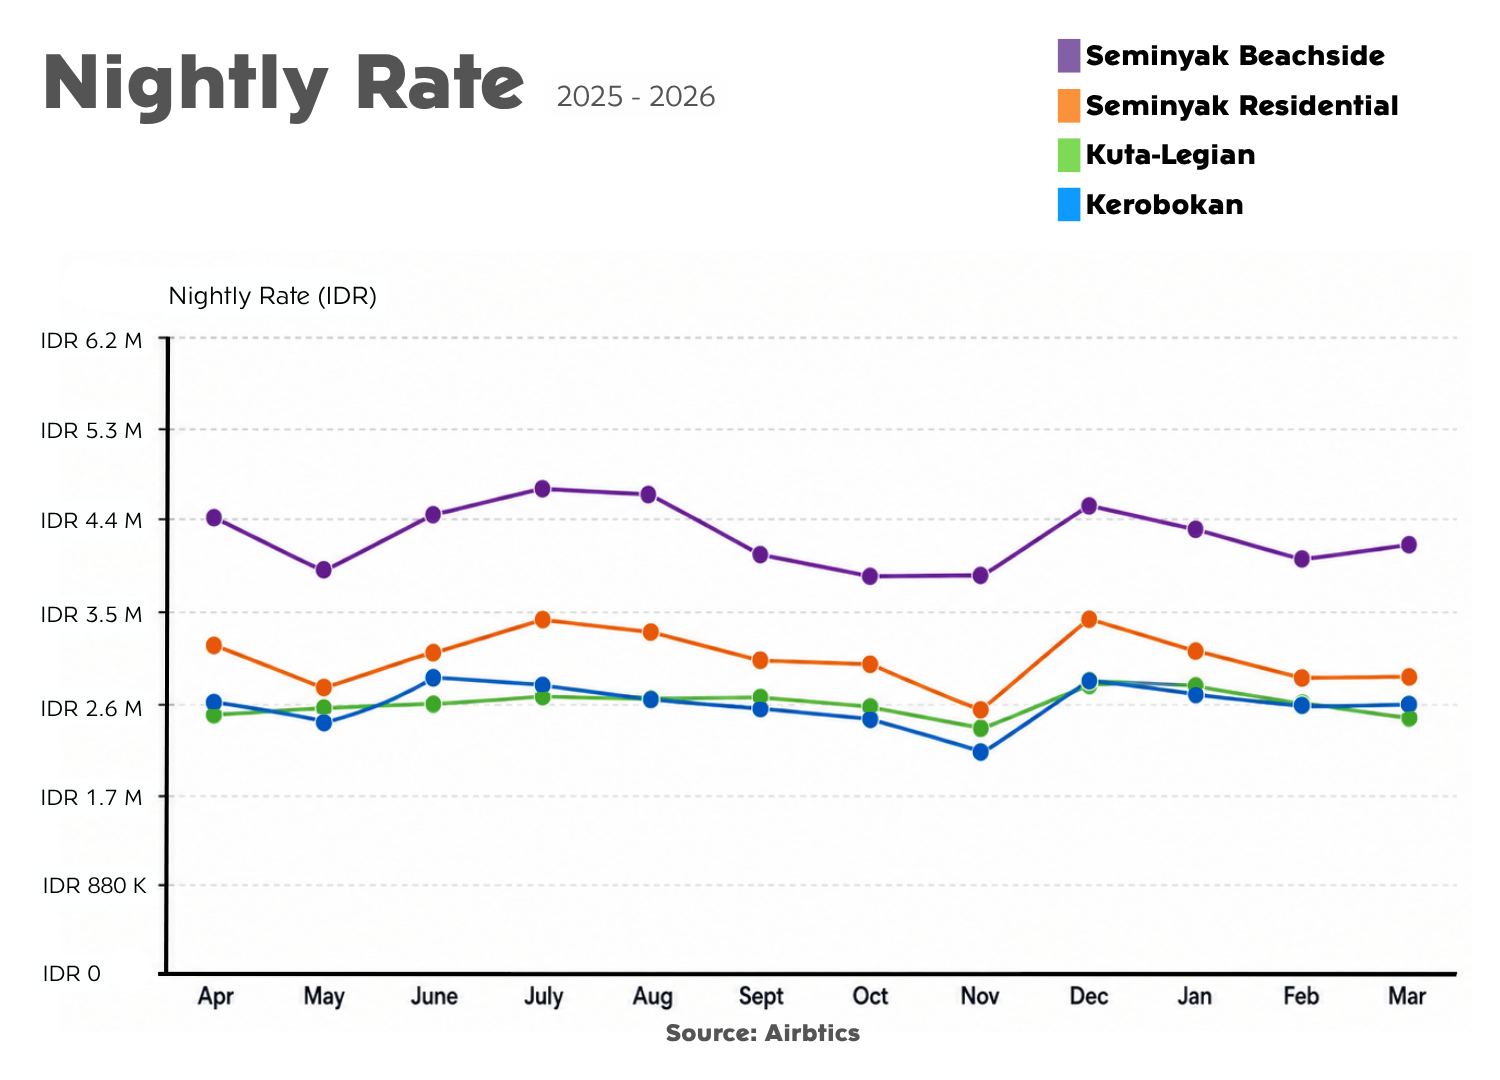
Seminyak Residential represents the chart’s quiet surprise. It consistently prices well above the higher-cost volume zones, commonly sitting in a resilient 2.500.000 to 3.000.000 IDR (approx. $160 to $190 USD) range and lifting sharply toward December where it approaches the 3.200.000 IDR mark (approx. $200 USD). This data points to a highly lucrative structural reality: the lowest land-cost tier on the map can still fully monetize Seminyak’s brand recognition, provided the underlying villa design is executed well and local access remains convenient.
Meanwhile, Kuta-Legian and Kerobokan align tightly for most of the year, hovering around the 2.400.000 IDR (approx. $150 USD) tier and trading places within the same narrow band. The subtle difference appears in low-season volatility. Kerobokan shows a more noticeable dip in November, falling closer to the low 1.600.000 IDR (approx. $100s), while coastal Kuta-Legian stays steadier. This highlights an essential inland reality: Kerobokan captures excellent revenue when demand overflows, but its pricing power softens faster if a property is built like a basic short-stay rental instead of a highly functional, long-stay residential base.
The Corridor’s Seasonal Carrying Capacity
Occupancy metrics reveal how efficiently each geographic tier converts its standing inventory into active booked nights. The most important signal across this entire data set is synchronization. Across all four analyzed zones, occupancy surges dramatically into July and August, clustering tightly together near the 90% to 95% threshold. This represents Bali’s peak-season carrying capacity turning on; when global travel to the island is strong, every sub-zone along this corridor is pulled upward simultaneously.
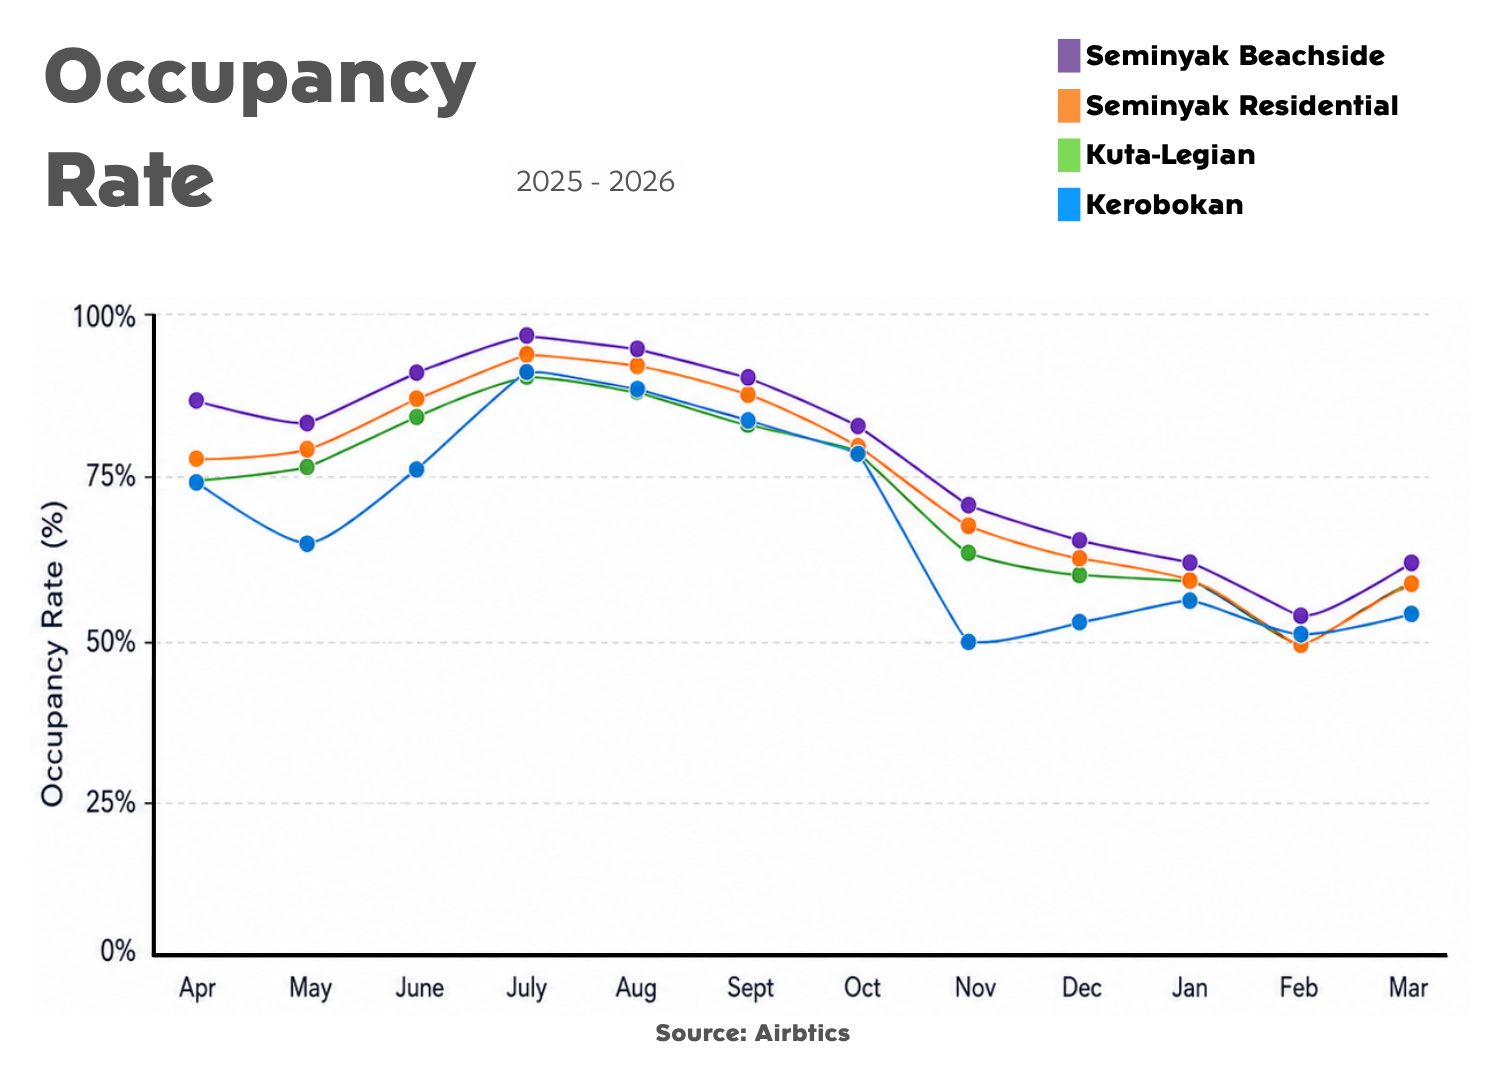
Outside of this high-summer peak, the spread between the tiers reveals the true risk tolerance of each location. Seminyak Beachside maintains its position at the top of the chart through almost every month, demonstrating that when the broader market cools, this tier contracts gradually rather than experiencing sharp volatility.
The critical operational insight is that Seminyak Residential tracks surprisingly close to the premium beachside core for much of the year, holding steady at 78% in April, 87% in June, and safely outperforming both Kerobokan and Kuta-Legian during shoulder and low seasons. This must be read as borrowed stability; target consumers actively want Seminyak access, but they do not always require an expensive beachfront address to book a stay confidently.
Down on the coastal strip, Kuta-Legian remains highly competitive through the peak summer surge and maintains solid performance in the shoulder months, reflecting its role as a high-volume commercial artery. Conversely, Kerobokan shows the sharpest low-season vulnerability, dropping down to the 50% occupancy range in November. The strategic implication here is clear: Kerobokan rewards villas specifically designed for monthly stays, enclosed living spaces, and superior daily usability, because the tenant profile shifts toward long-stay expats faster there during the low season.
What the Market Pays After Rate and Occupancy Interact
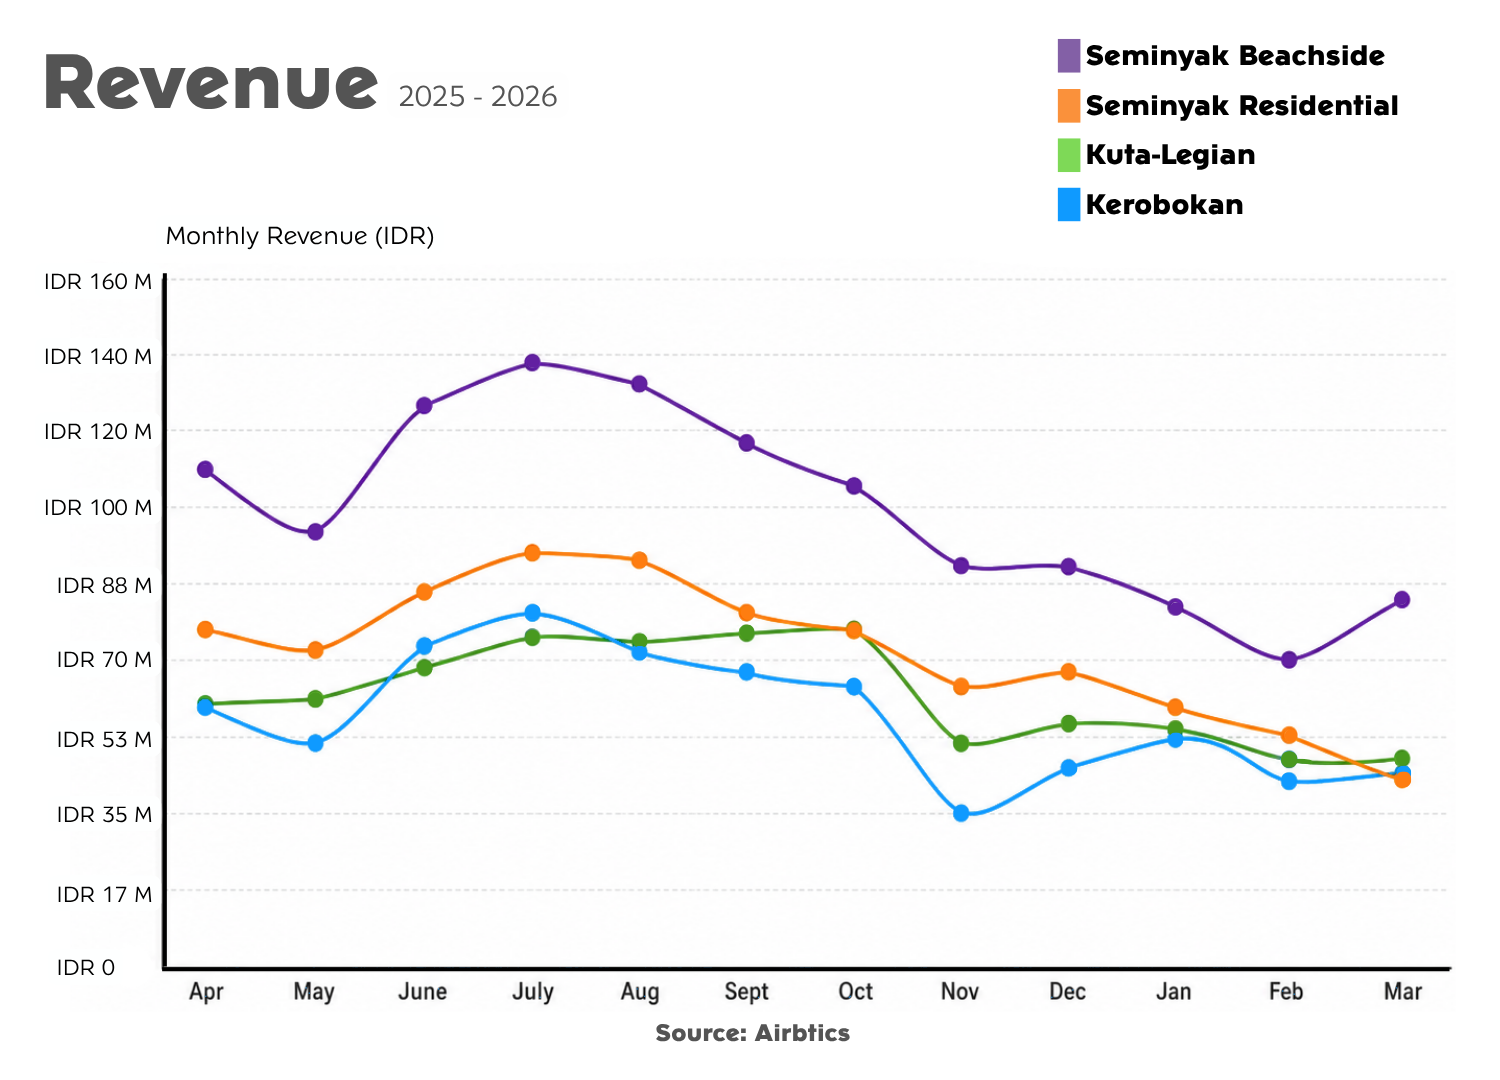
Gross revenue serves as the final scoreboard because it captures exactly what happens when pricing power and asset absorption interact over a twelve-month cycle.
Seminyak Beachside
This area sits far above the other competitive zones throughout the year, peaking mid-year from June to August in the 112.000.000 to 128.000.000 IDR (approx. $7,000 to $8,000 USD) monthly range. While it tapers into the predictable early-year dip, it quickly rebounds toward March. This chart pattern shows exactly why Tier 1 land is priced at a premium: the local market efficiently converts beachfront proximity into the most durable, high-value cash flow available along the coast.
Seminyak Residential
This area typically holds the second-highest revenue line on the scoreboard. It generates a powerful mid-year peak around the 86.400.000 IDR (approx. $5,400 USD) mark and maintains a remarkably resilient floor as the broader market cools. This is the "aha" tier for numbers-driven developers. It sits within the lowest land price band on the map, yet its revenue curve behaves like a compressed version of the premium beachside market rather than a peer of the lower-cost volume zones. Lower upfront land costs paired with a resilient ADR and tight occupancy tracking create an undeniable cash-on-cash yield advantage.
Kuta-Legian and Kerobokan
Align closely through the mid-year peak, climbing into the 68.800.000 to 73.600.000 IDR (approx. $4,300 to $4,600 USD) monthly range. This performance confirms Tier 2’s core promise: maximizing seasonal throughput while operating on a materially lower land acquisition cost than the beachfront core.
However, November exposes the operational differences between these two sub-zones. Kerobokan’s gross revenue drops sharply to the 32.000.000 IDR zone (approx. $2,000 USD), while Kuta-Legian handles the low-season decline better, holding closer to the upper 32.000.000 to 48.000.000 IDR range (approx. $2,000 to $3,000 USD). In practice, an inland Kerobokan asset can generate strong peak-season returns, but it requires precise property positioning and design to avoid low-season compression from eating into annual cash flow.
Maximizing Your Carrying Capacity with Us
Successful land acquisition in this mature zone requires balancing upfront lease expenditures against the localized carrying capacity of each neighborhood. Every tier along this coast has a clear mathematical purpose, and an investor's edge lies in choosing the specific band that matches their broader operating model.